September 16, 2026 · 4 min read
Monitoring RBMC
How I used Sentinel, my monitoring tool, to track all 157 RBMC stations — and what that changes for IBGE and for anyone using RTK or post-processing.
I've been at IBGE (Brazil's national mapping and statistics institute) for a year now, and I recently moved from cartography to geodesy, so I decided to take on a problem I keep seeing in the surveyors' WhatsApp groups I'm in. There's always a conversation like this:
"Is the VICO station down?"
"Yeah, since last week."
"Ugh, I needed to run an NTRIP session in that area."
Well, it's true, RBMC does go down a lot. And it's not always IBGE's fault.
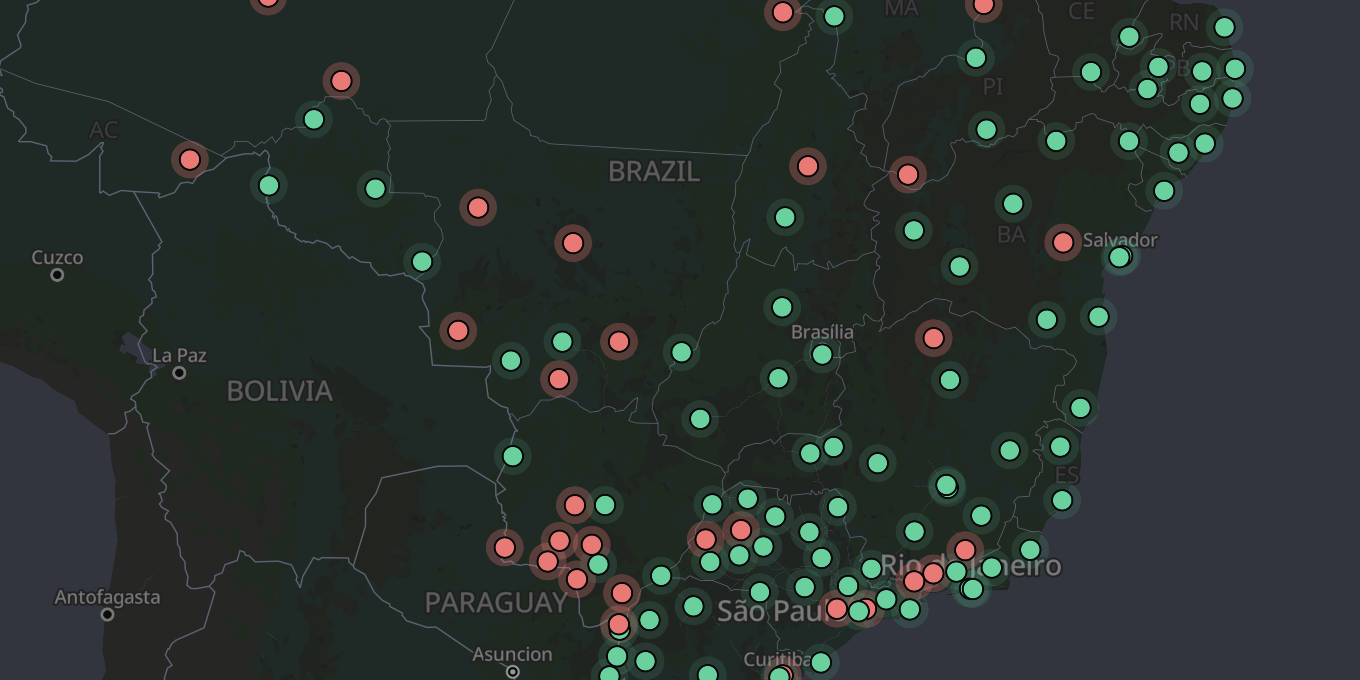
RBMC currently has 157 stations, most of them installed at partner institutions all over Brazil — universities, federal institutes, INMET (the national weather service), INCRA (the land-reform agency), and plenty of other places. Every installation follows strict criteria for positioning, power, network, stability, but the truth is that even with all the care in the world, things happen. Internet drops, power drops, lightning propagates through the network cabling (believe it, it happens) frying network ports, all of it.
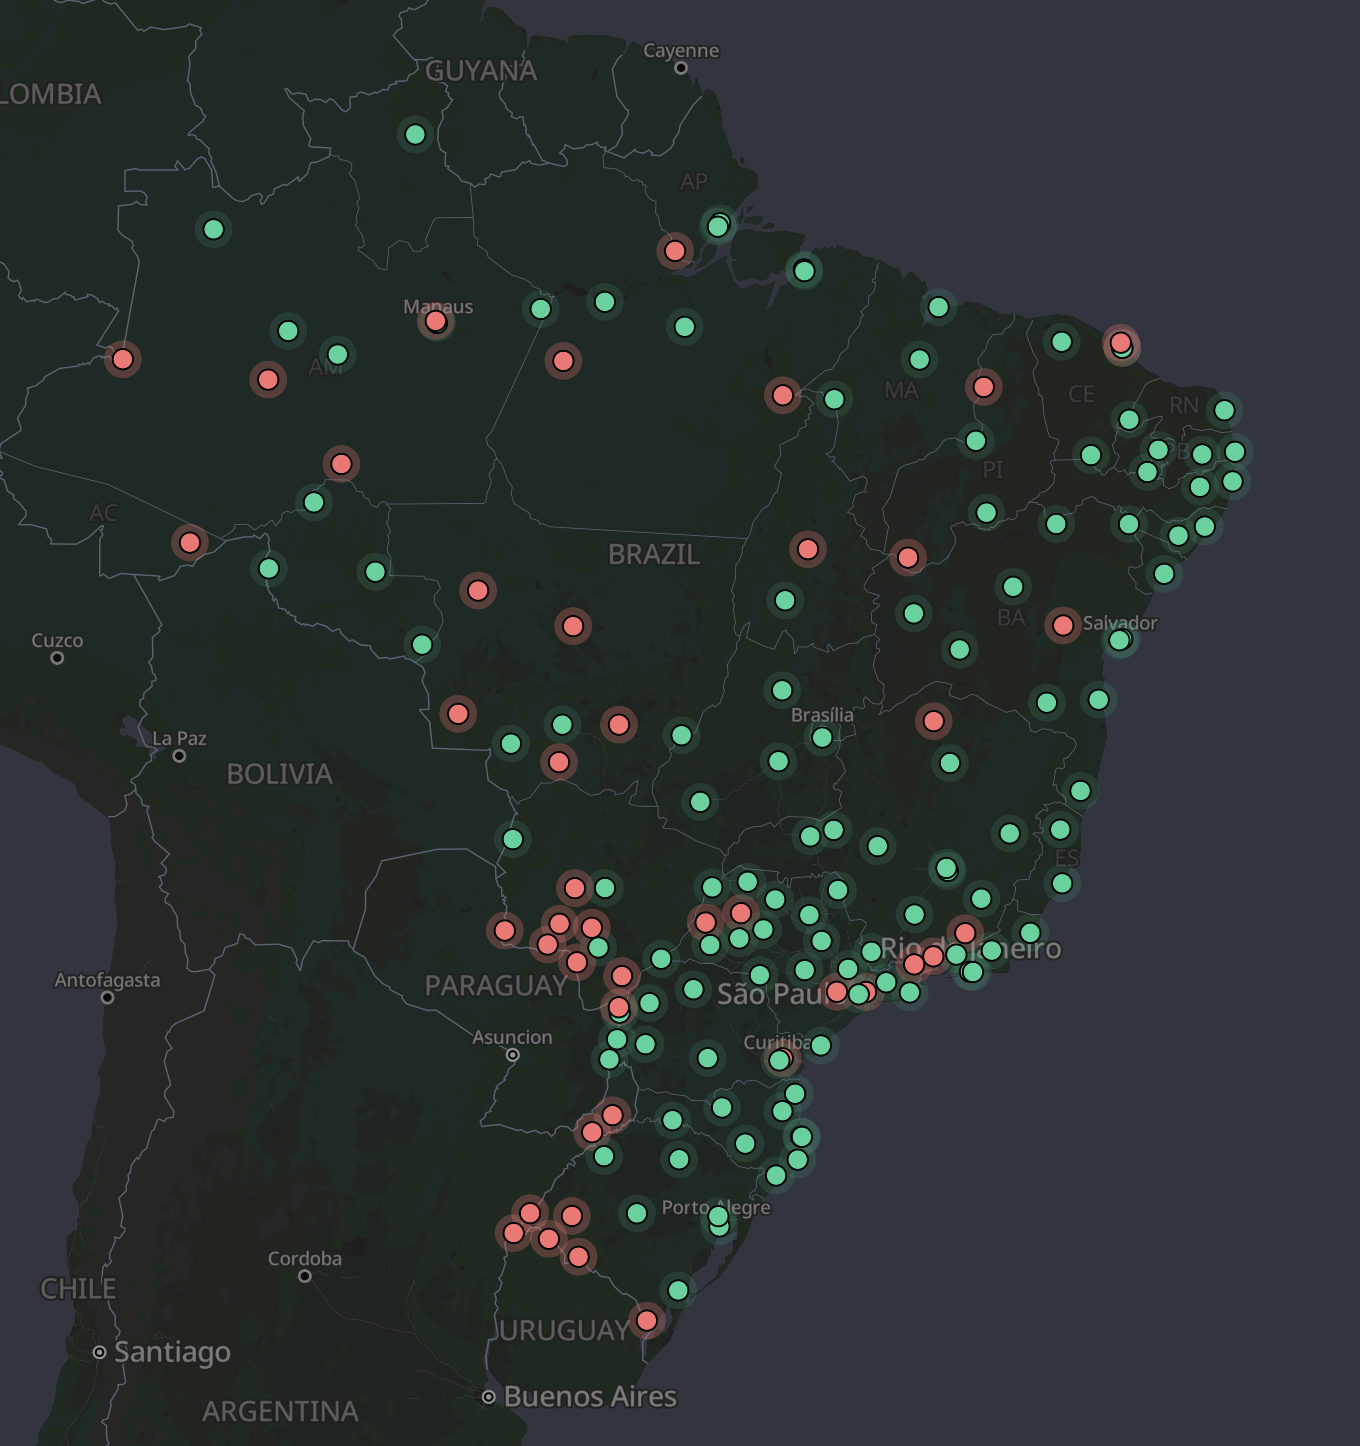
And monitoring these 157 stations isn't easy, especially since, until now, our only option at IBGE was to manually check whether data was reaching the NTRIP server, identify the failures, and reach out afterward.
That's when I decided to take a tool I already use across several projects — Sentinel — and adapt it to work here.
What is Sentinel?
Technical part, skip it if you don't want to get bored.
Sentinel is a synthetic-monitoring platform I built to check freshness, uptime and business logic for web applications that need that kind of constant checking.
For example, say I have an API that pulls weather forecast data. I need to guarantee that data is never more than 2 hours old since its last update. Sentinel lets me write a test in JavaScript that verifies that condition, and if it's not met, sends me a notification somewhere — Discord, Slack, a webhook, whatever.
In practice, a test is a JavaScript function with a small API (ctx) that gives access to HTTP, file downloads, secrets, whatever the check needs. It runs on a schedule (every 5 minutes, every hour, whatever you configure) and returns one of three results: pass, warn (degraded) or fail. Every state change fires a notification, and every run is kept as history — so you can look back and see exactly when, and for how long, something was down.
How do you use Sentinel to monitor RBMC?
Using Sentinel to monitor RBMC is simple. IBGE exposes NTRIP data through the caster server at http://gps-ntrip.ibge.gov.br:2101/.
That address exposes information for all 157 RBMC stations, when all of them are available — it's the NTRIP protocol's so-called sourcetable. A basic check makes sure a given station code shows up in a STR line of that response. A real excerpt, with the VICO station (Viçosa) highlighted:
CAS;gps-ntrip.ibge.gov.br;2101;Ntrip_Prof_1.5.8;IBGE;0;BRA;-22.91;-43.22;http://www.ibge.gov.br/home
NET;RBMC-IP;IBGE;B;N;http://www.ibge.gov.br/home/geociencias/geodesia/rbmc/rbmc.shtm;https://gps-ntrip.ibge.gov.br/skl/;http://www.ibge.gov.br/home/geociencias/download/tela_inicial.php;none
...
STR;VICO1;Vicosa;RTCM 3.0;1004(1),1006(1),1008(10),1012(1),1013(1),1019(15),1020(15),1033(10);2;GPS+GLO;RBMC-IP;BRA;-20.76;-42.87;0;0;TRIMBLE NETR9;none;B;N;1500;RBMC-VICO
If the station code shows up like that, in a STR line, everything's fine — service OK. If it doesn't show up, there's a problem: degraded or down.
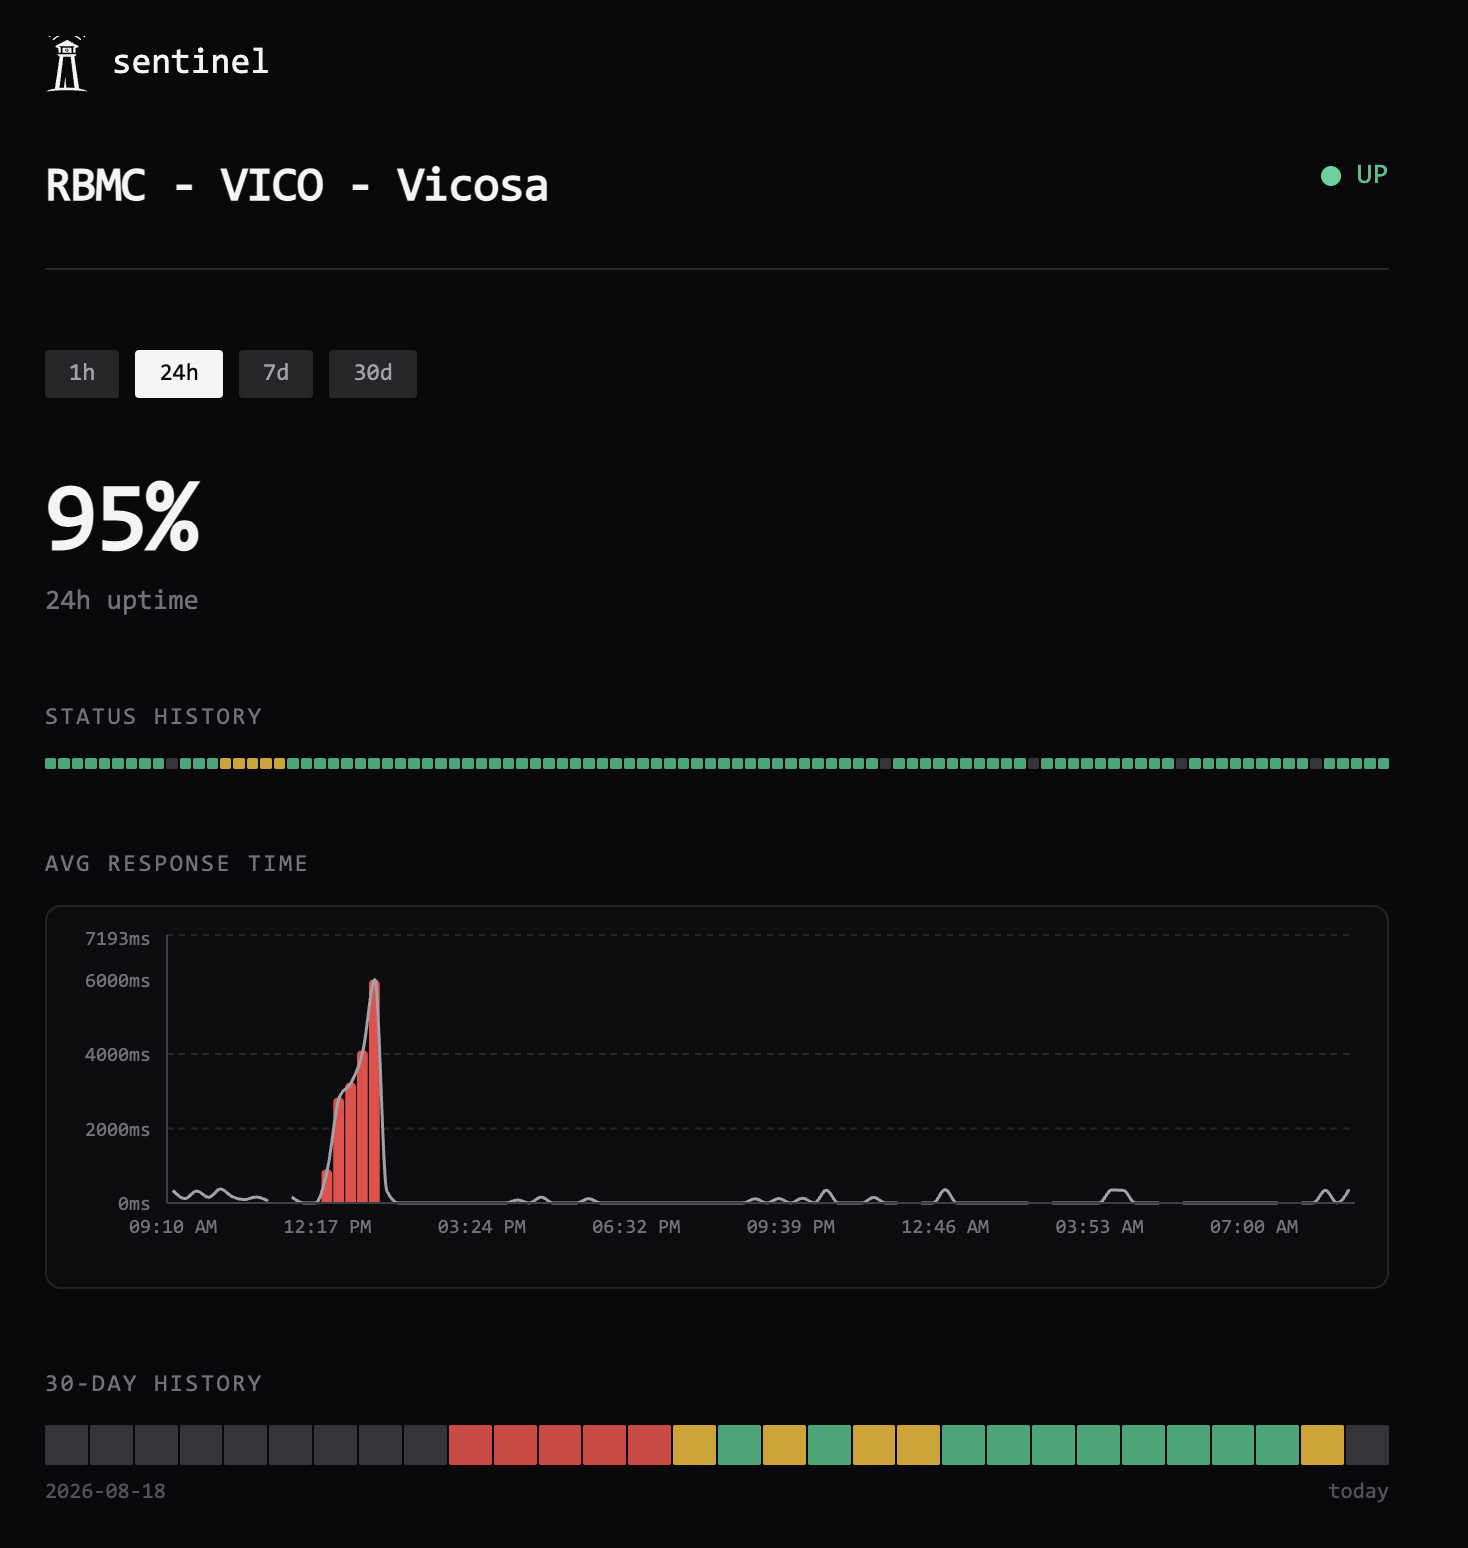
The nice part is that Sentinel lets me look at each station's history, and see exactly when it went down. And that conversation from the beginning isn't hypothetical: this is exactly what happened to VICO. Here's its history:
Taking it a bit further
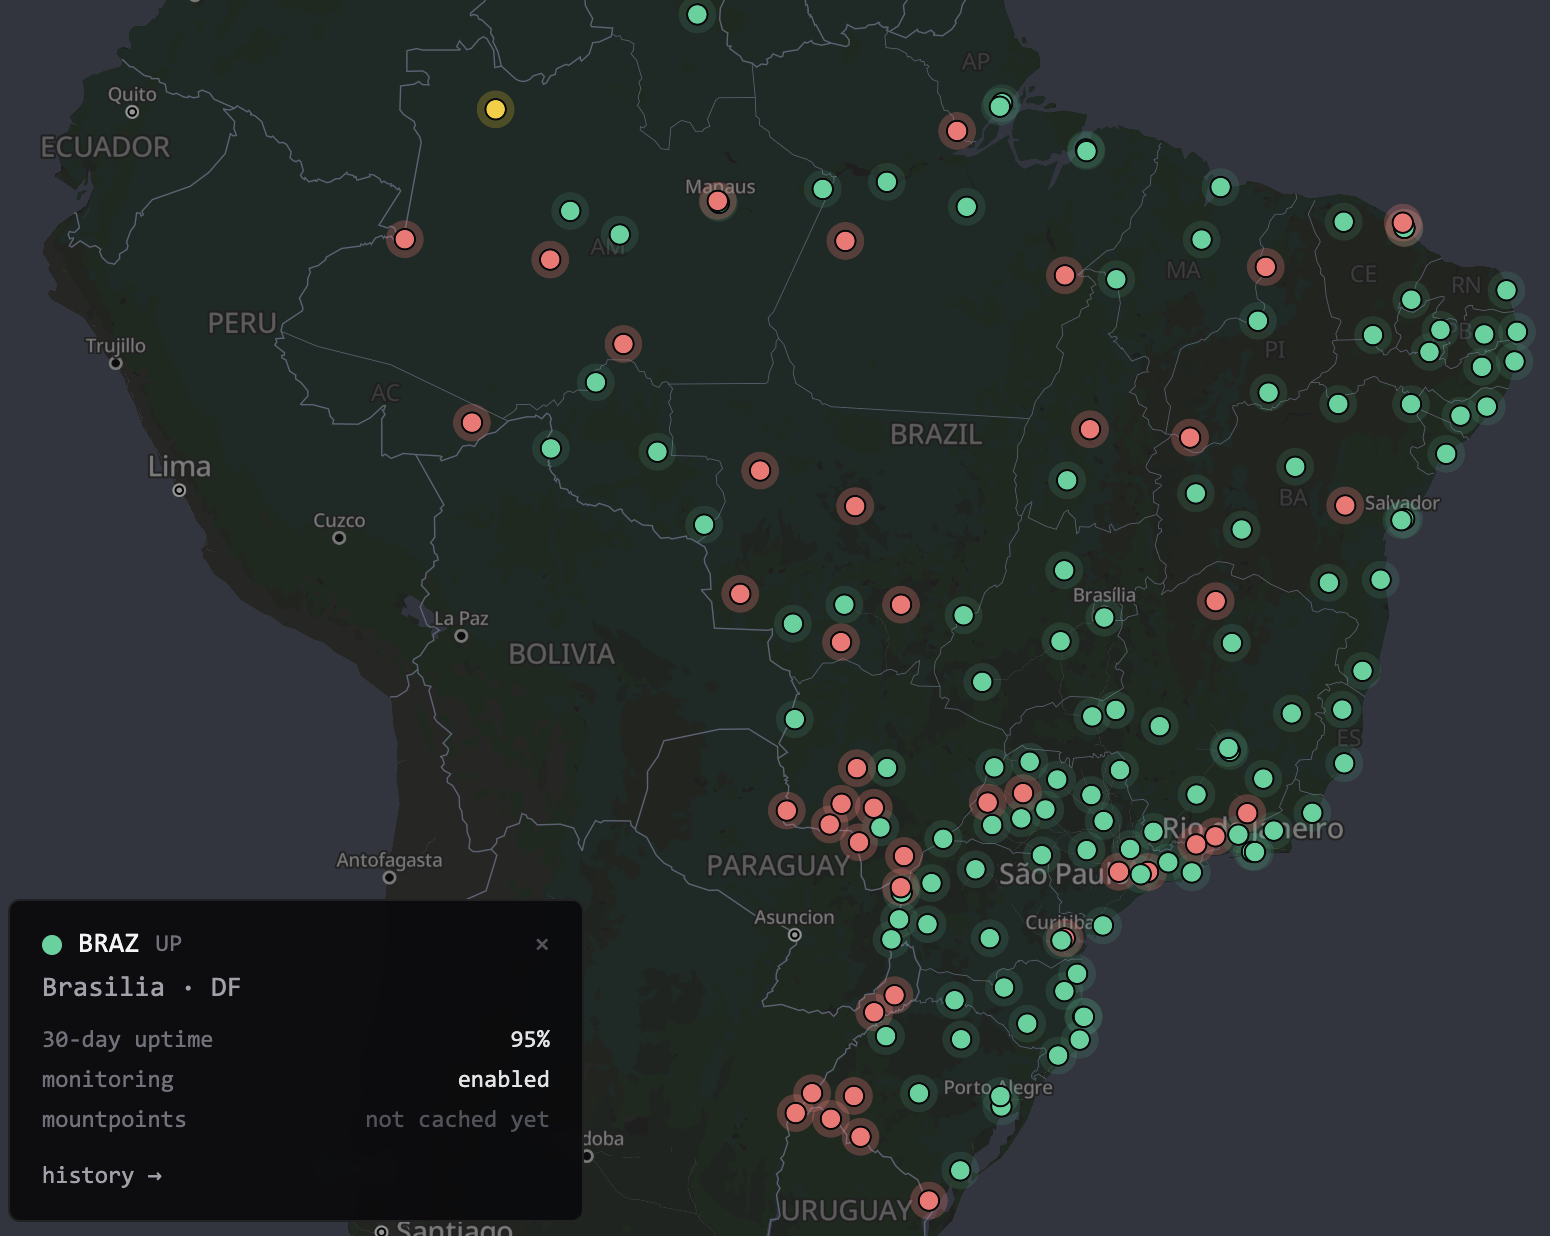
The first time I set this monitoring up, I felt it needed a bit more seasoning. So I created a dedicated branch of Sentinel to monitor RBMC, with a map, click-through history, and a station list fed automatically from the shapefile exported from BDG (Banco de Dados Geodésicos, IBGE's geodetic database).
That part solves an annoying problem: keeping 157 tests up to date by hand. On this branch, a sync job reads the BDG shapefile as soon as Sentinel starts and whenever the file changes, and reconciles one test per station automatically — no manual work needed. A station new to the shapefile gets a new test; one that drops out (disabled, removed) gets its test disabled, never deleted, so the history stays there if it comes back. The map shows every station colored by status, and clicking a station shows its details, its 30-day uptime, and a link to the full history:
Each test runs every 15 minutes, and requests to the caster are cached for 60 seconds — so checking all 157 stations costs IBGE's server one request a minute, not 157. Costs nothing to be a good neighbor to the very infrastructure you're monitoring.
Sentinel is open source (github.com/paschendale/sentinel), and this RBMC monitoring branch is published and available to anyone at rbmc.marotta.dev/status.
OK, but what's this actually for?
There are two interesting uses here.
First, for IBGE. Sentinel lets us proactively identify issues and act to fix RBMC's access with partner institutions. Before, if a peripheral station went down, we'd only notice once we processed the SIRGAS network data weeks later. Now Sentinel itself tells us.
Second, for the community. We ourselves, as surveying engineers and RBMC users, get information about each station's status. It makes it easier to have transparency about how the network is running, and to hold ourselves (as IBGE) accountable for keeping it that way.
Explore my work
If this was useful, take a look at the platforms I've built or get in touch about a project.