Territorial product
Sentinel
A programmable synthetic-monitoring platform: tests as JavaScript, alerts on state change, public status pages, on a 1 GB VPS.
Existing uptime monitors either ping URLs from YAML or grow into heavy dashboards. Sentinel runs real JavaScript test functions on a schedule, validates business logic, and alerts through Discord, Slack or webhooks. It watches every platform I run, plus IBGE's national GNSS network.
At a glance
- Tests are plain JavaScript with a small ctx API: HTTP, FTP, S3 (hand-rolled SigV4), secrets, assertions and warnings
- Three-tier outcomes (pass, warn, fail), failure thresholds, cooldowns and per-event-type channel routing
- Public status pages per tag, Prometheus metrics, encrypted secret store and a full MCP server for AI agents
- Designed for 1 GB RAM and half a vCPU: batched writes, partitioned tables, pre-aggregated daily stats
Why another monitor
I needed to know a client's pipeline had gone stale before the client did. A 200 response from an API says nothing about whether the forecast behind it is six hours old, or whether a GeoServer layer still has data. Config-driven monitors could not express that; dashboard-first tools could not run hundreds of checks on a small box. Sentinel is the tool I wanted: a test is a function that receives a context and returns true or false, and the platform handles scheduling, retries, alerting and history.
Architecture
The whole design is driven by one deployment target: a 1 GB, half-vCPU VPS running around 500 tests a minute. A single Fastify process on Node.js schedules tests with jittered intervals, compiles user code once on save, races each run against its timeout, and caps concurrency with a small slot pool. Results are buffered and flushed to PostgreSQL in batches into month-partitioned tables; a daily aggregate table feeds the public status pages so they never touch raw runs. Outbound HTTP goes through Undici with per-host connection pooling. Secrets are AES-256-GCM encrypted at rest and exposed to tests as a synchronous in-memory object.
Notifications are event-driven and fire-and-forget: a test flips to fail only after N consecutive failures, warnings fire on first occurrence with a cooldown, recovery is its own event, and each channel assignment filters which event types it receives. The dashboard is a Next.js app that can be deployed on Cloudflare Pages with only the API and database on the VPS. An MCP server wraps the REST routes in-process, so an AI coding agent can create, run and inspect tests through the same validation and auth.
In production: the RBMC network
The most demanding public deployment monitors RBMC, the Brazilian Network for Continuous Monitoring of GNSS Systems operated by IBGE. RBMC is a network of roughly 150 permanent GNSS stations across Brazil that stream and publish continuous satellite observations. It is the physical realisation of SIRGAS2000, the national geodetic reference frame, and the backbone for precise positioning in the country: post-processed surveys, real-time corrections, rural cadastre georeferencing, engineering monitoring and scientific work all depend on its data being available and current.
The RBMC status page tracks each station individually with 24-hour history, so a surveyor can check whether the station nearest a job site is publishing before heading out. Sentinel also watches the Jane's Weather platform with 63 tests, and every service behind Skyport and MapPrism.
More projects
All projects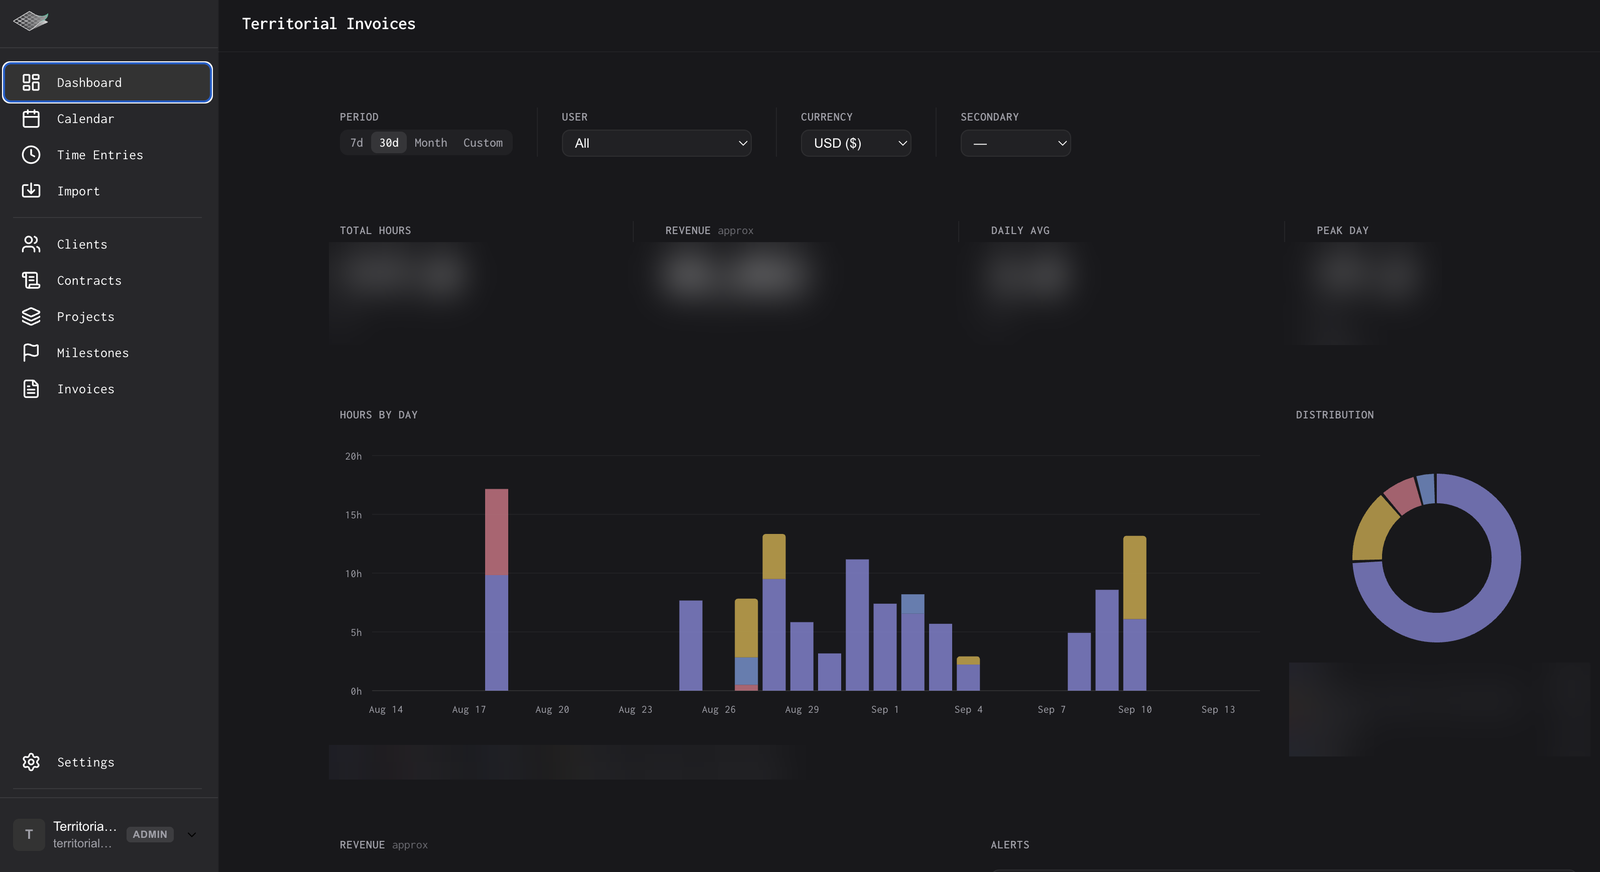
Territorial Invoices
The system that runs Territorial's billing: calendar-based time tracking, contracts with deterministic billing math, and invoices generated in minutes.
- Next.js
- Fastify
- Prisma
- PostgreSQL
- +4
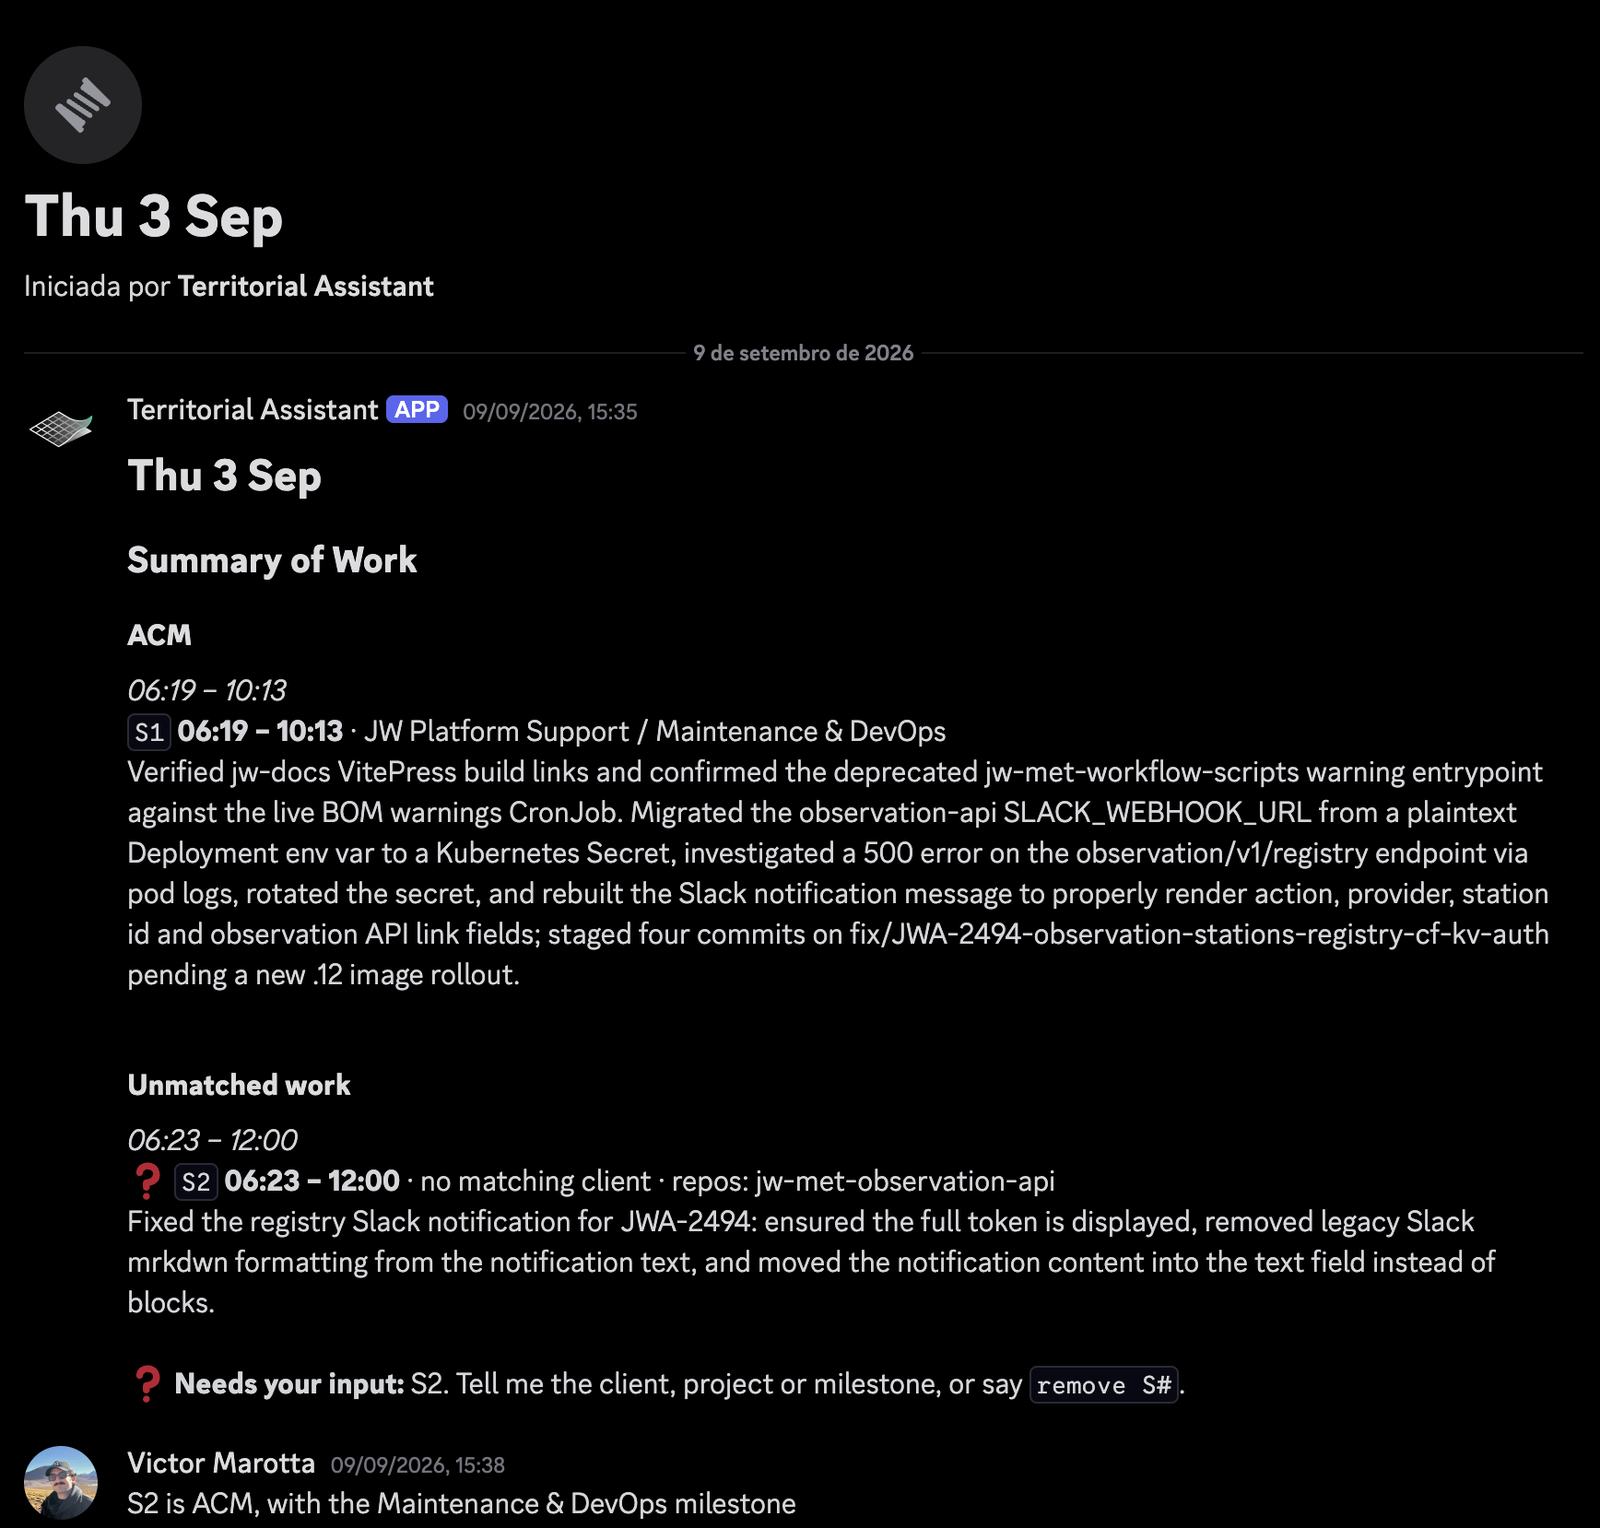
Territorial Assistant
A Discord-based daemon that turns my own work activity into approved timesheets and a curated knowledge base of engineering stories.
- TypeScript
- discord.js
- Drizzle
- PostgreSQL
- +3
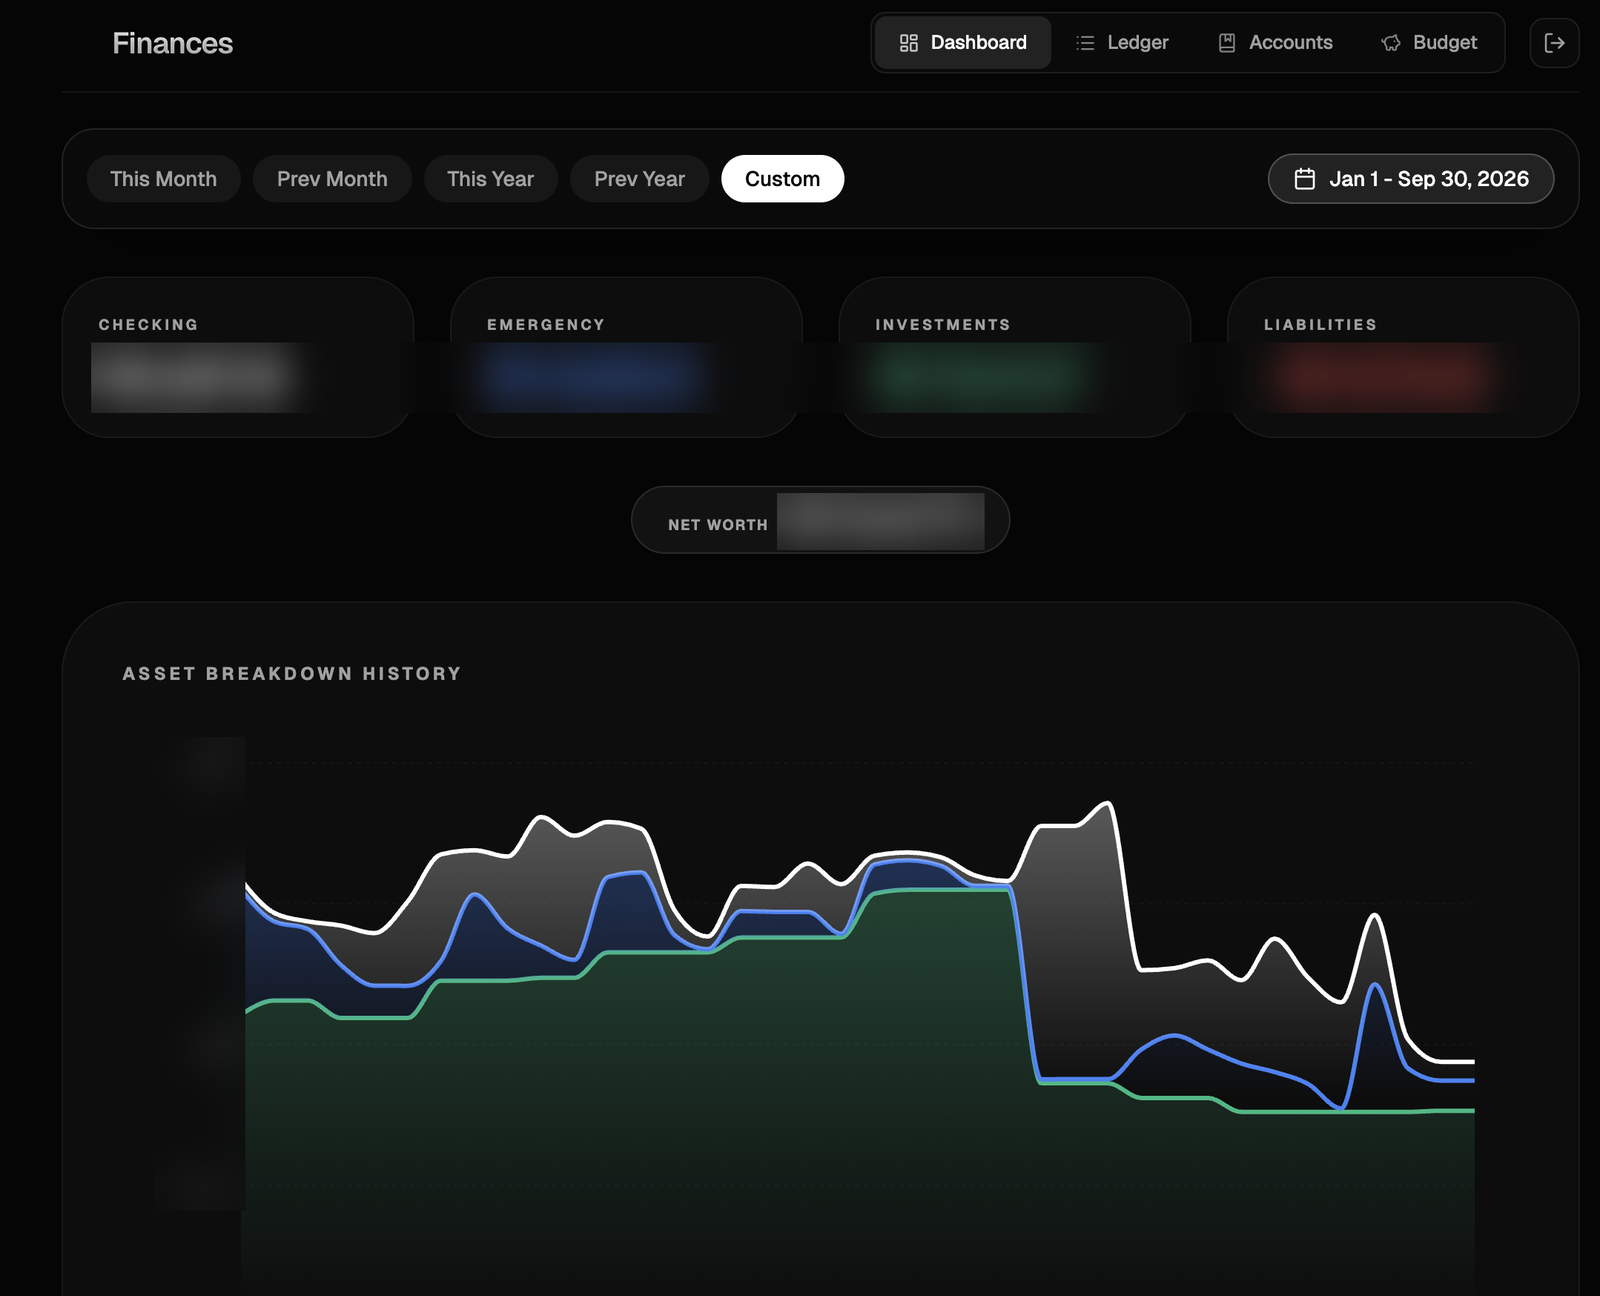
Finances
A personal ledger and budgeting app with a Postgres-first architecture: one PostgREST instance, a static frontend, nothing else.
- PostgreSQL
- PostgREST
- React
- Vite
- +5