Personal R&D
Slope
Draw a line on a map and get a live elevation profile computed straight from a PostGIS raster.
Architecture
- Draw a linerlayers map
- API routeNext.js · node-postgres
- PostGISsample raster at native resolution
- ProfilePlotly chart
A prototype exploring how far PostGIS can go for interactive analysis without a heavyweight backend: a Next.js map with rlayers, a single API route with raw SQL, and a Plotly chart that updates as you draw.
At a glance
- Reads the raster's native pixel resolution and samples the drawn line at that resolution
- Interpolates elevation values from the raster in SQL; no Python, no GDAL service
- Parameterised queries, whitelisted table names and a bearer token on the API route
- Next.js, React, rlayers (OpenLayers), Plotly and node-postgres
Why
Elevation profiles are a classic GIS task usually solved with a desktop tool or a processing service. I wanted to see whether the database alone could serve them interactively. It can: PostGIS raster functions handle sampling and interpolation fast enough that the profile feels live while the user is still drawing.
More projects
All projects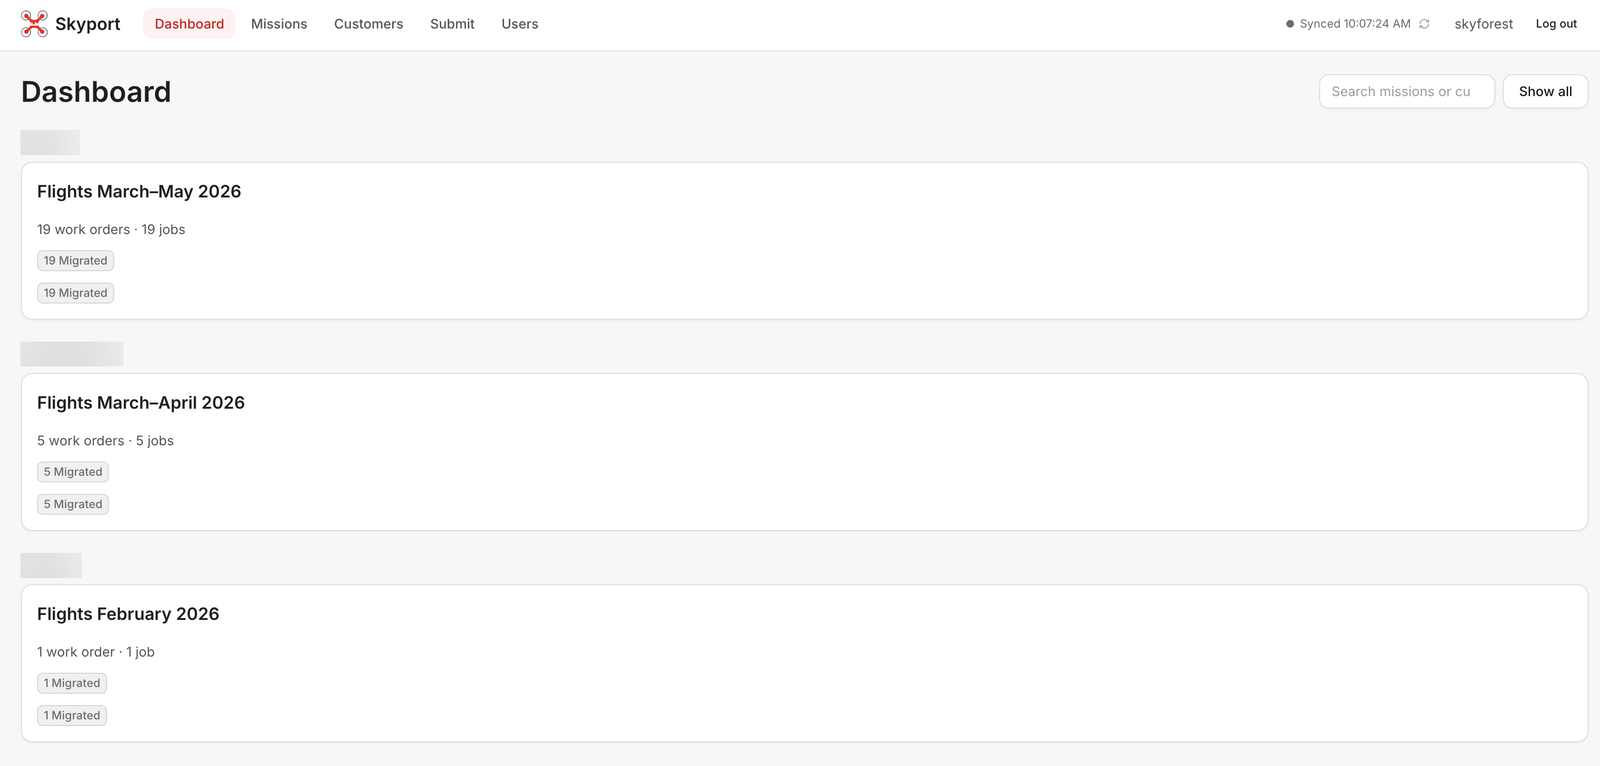
Skyport
The operations platform that turns Skyforest's drone flights into finished map layers, end to end.
- n8n
- Ordo
- Next.js
- MapLibre
- +6
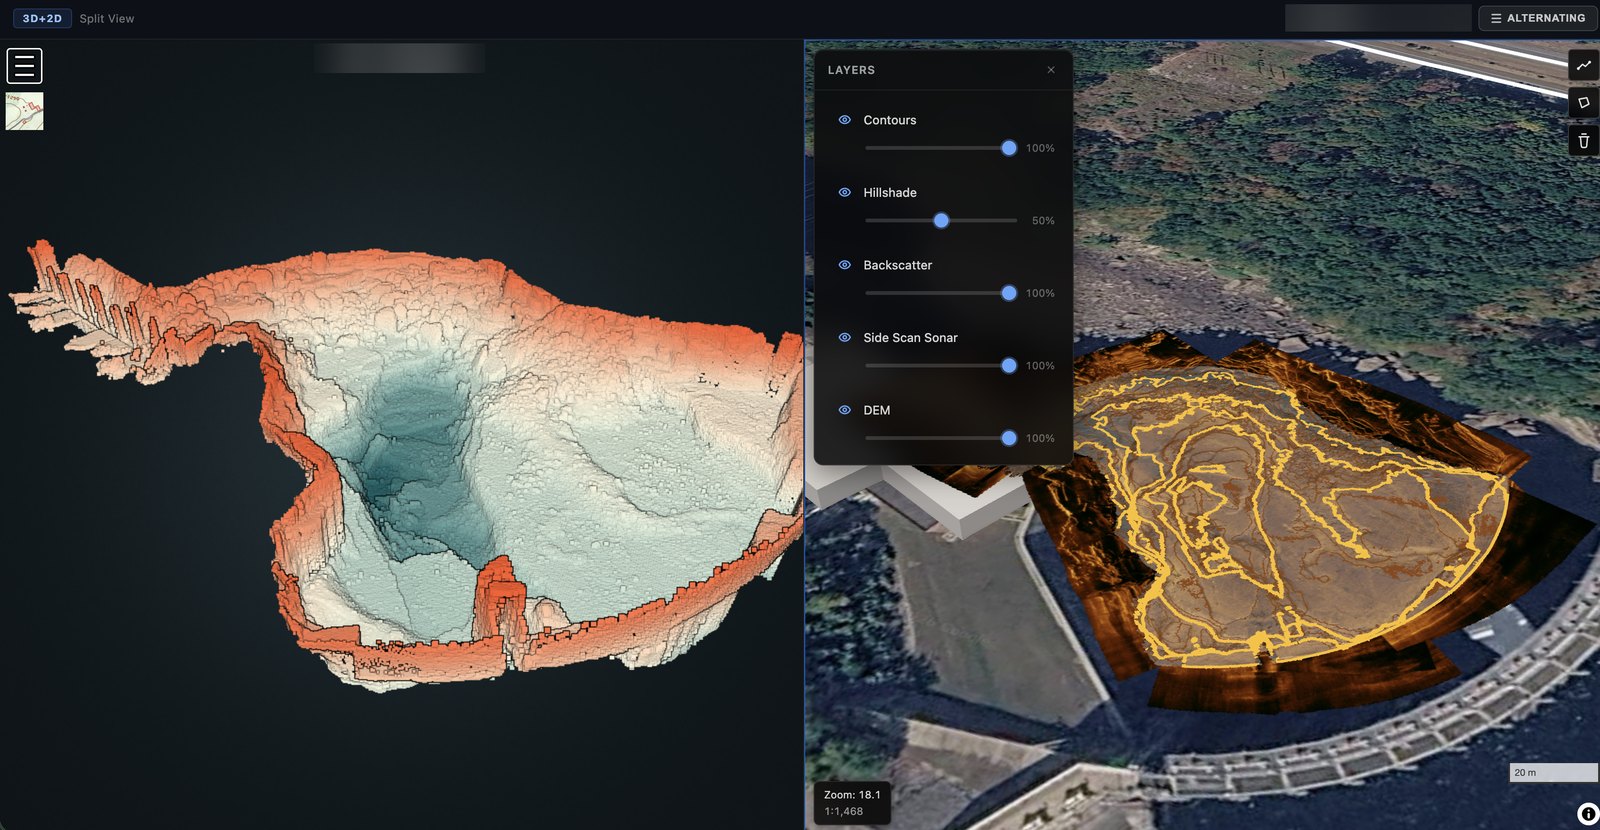
MapPrism
A LiDAR and bathymetry processing platform that turns raw point clouds into web-ready 3D and 2D products automatically.
- Ordo
- n8n
- PDAL
- GDAL
- +7
- Weather providers
- Argo Workflows
- Storage
- Edge Workers
- Weather map & clients
Weather-Data Platform
Lead engineer for Jane's Weather, an Australian weather-data platform now part of ACM: from building its weather map to running the whole platform with the Territorial team.
- React
- MapLibre
- PMTiles
- Python
- +10